Viewing data
The most convenient way of presenting database contents is in a form of a tree. The database itself may be treated as a root of the tree where the first branches are materials. Each material description may parent one or more sample descriptions. To each sample one or more measurement descriptions may be attached. The last level consists of result descriptions. A sample of the tree view structure is shown above.
 The
tree view of the base is shown in separate child window which may be invoked
either by clicking the toolbar button or through the [View|Tree
View
] menu entry. The tree view of the database contents is presented in
a form of the standard Windows tree view structure. All the standard ways of
manipulating it may be applied. It includes collapsing and expanding the tree
nodes, selecting them, dragging onto other windows and calling a pop-up menu.
The
tree view of the base is shown in separate child window which may be invoked
either by clicking the toolbar button or through the [View|Tree
View
] menu entry. The tree view of the database contents is presented in
a form of the standard Windows tree view structure. All the standard ways of
manipulating it may be applied. It includes collapsing and expanding the tree
nodes, selecting them, dragging onto other windows and calling a pop-up menu.
Tree view window may be opened when program starts. This action is controlled by setting an appropriate flag on the Options screen that is invoked through the [File|Options ] main menu entry. On the same options screen a default tree expansion level may be set.
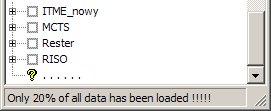 |
 On the window opening the tree will be filled with data. For large
databases it may be quite a long process. It is possible to break tree creation:
special Stop button is displayed in window toolbar area. Clicking it, or
pressing Esc key, stops data loading. Special tree entry is appended to
it indicating that not all data is loaded and displayed. There is also
appropriate message in window status area. The window foot may look like this:
On the window opening the tree will be filled with data. For large
databases it may be quite a long process. It is possible to break tree creation:
special Stop button is displayed in window toolbar area. Clicking it, or
pressing Esc key, stops data loading. Special tree entry is appended to
it indicating that not all data is loaded and displayed. There is also
appropriate message in window status area. The window foot may look like this:
 It
is possible to expand or collapse the whole displayed tree to a certain detail
level by clicking one of the toolbar buttons numbered 1 to 4.
It
is possible to expand or collapse the whole displayed tree to a certain detail
level by clicking one of the toolbar buttons numbered 1 to 4.
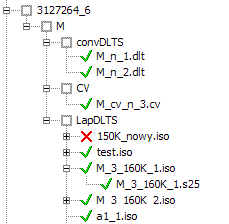 There are different kinds of nodes, as
you can see on the view sample. Although only four levels of details may be
selected, there are five mode levels shown. The additional, intermediate level
consists of virtual nodes corresponding to measurement types defined in the
base. On the sample you can see three of them: convDLTS, CV and
LaplDLTS. This level is used only in order to make the base structure
mode readable.
There are different kinds of nodes, as
you can see on the view sample. Although only four levels of details may be
selected, there are five mode levels shown. The additional, intermediate level
consists of virtual nodes corresponding to measurement types defined in the
base. On the sample you can see three of them: convDLTS, CV and
LaplDLTS. This level is used only in order to make the base structure
mode readable.
Virtual, intermediate nodes are not displayed when using filter function and selecting only one measurement type as a part of filter condition.
 Each
measurements and results tree item is associated with a data file. The tree item
may be accompanied by a mark indicating whether this specified file is
accessible or not. A green tick mark indicates that the file is available, a red
cross that it has not been found at the location specified. It is possible to
turn the check mark display on and off using the toolbar button shown on the
left.
Each
measurements and results tree item is associated with a data file. The tree item
may be accompanied by a mark indicating whether this specified file is
accessible or not. A green tick mark indicates that the file is available, a red
cross that it has not been found at the location specified. It is possible to
turn the check mark display on and off using the toolbar button shown on the
left.
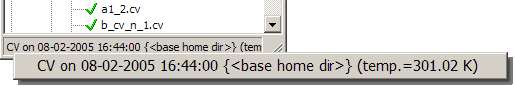 |
Selecting (highlighting) a tree entry causes its brief description to be displayed in the status bar of the tree view window. If the description is too long to fit into the status panel, it may be displayed as a tool tip or - by clicking the panel - in a pop-up as in the example below:
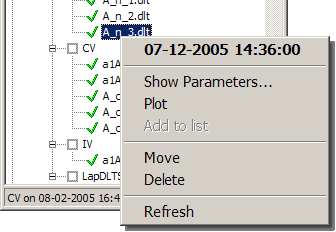 Clicking right mouse button on a node
brings up a context menu. Its contents depend on the type of the node selected.
In general, the first menu item is a description of the selected item.
Clicking right mouse button on a node
brings up a context menu. Its contents depend on the type of the node selected.
In general, the first menu item is a description of the selected item.
For all non-virtual node types there is a Show Parameters item which calls the appropriate edit screen for that item and a Delete menu item. The later removes not only selected tree node, but also corresponding database entry, as well as all other subordinate entries referencing it.
A Refresh entry is displayed for all nodes that may have child nodes; action invoked causes rebuilding selected tree branch from database.
A Move entry is displayed only for measurement nodes and is used to alter measurement data structure: selected data file may be assigned, in the data base, to different sample than originally denoted by appropriate file entry. This file entry may also be modified, if requested, to reflect change made in the base.
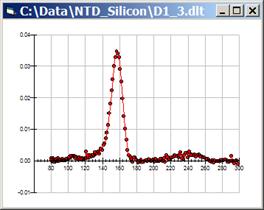 A Plot entry is displayed for measurement and
result nodes, i.e. nodes referencing some experimental data. It displays a
diagram showing the data itself. This function is implemented only for purpose
of reviewing the data, not as a tool for data analysis, so it is not possible to
manipulate the diagram or data, although it can be printed using the System
tab of the property screen called by the right button mouse click. The menu item
is disabled when it is not possible to access the specified data file. Sample
plot window is shown to the left.
A Plot entry is displayed for measurement and
result nodes, i.e. nodes referencing some experimental data. It displays a
diagram showing the data itself. This function is implemented only for purpose
of reviewing the data, not as a tool for data analysis, so it is not possible to
manipulate the diagram or data, although it can be printed using the System
tab of the property screen called by the right button mouse click. The menu item
is disabled when it is not possible to access the specified data file. Sample
plot window is shown to the left.
 The database entries can be inspected
and edited using editing screens. Depending on level of information (branch of
the tree view) a different editing screen is openned, however for all of them
the same rules apply. The editing screens are invoked by clicking the toolbar
buttons, through the main menu commands [View|Material
], [View|Sample
],
[View|Measurement
], [View|Result
] or
by selecting the Show
command from the pop-up menu
displayed on the tree view.
The database entries can be inspected
and edited using editing screens. Depending on level of information (branch of
the tree view) a different editing screen is openned, however for all of them
the same rules apply. The editing screens are invoked by clicking the toolbar
buttons, through the main menu commands [View|Material
], [View|Sample
],
[View|Measurement
], [View|Result
] or
by selecting the Show
command from the pop-up menu
displayed on the tree view.
In general, a grey field background means that its contents cannot be edited. Due to the fact that it has not been possible to apply the same convention to lists, parameters that may be edited have their name preceded by an asterisk.
A set of navigation buttons at the bottom of the form is used to move between records. A frame labelled Select contains controls (combo boxes and buttons) used for selection and/or filtering of records to be displayed. This set of buttons along the lower edge of the form is almost the same on all the forms:
New is used to add the new, empty record,
New copy acts as New and is used to add new record, but all data from current record are copied to appropriate text boxes and are available for editing,
Import is used to import data file into the base,
Delete is used to delete current record,
Restore is used to abandon changes made to the data displayed,
Save makes changes permanent,
Refresh is used in multi-user environment to ensure that the currently displayed data is the most recent; the database engine refreshes the data base automatically, however this is done at fixed time intervals. The Refresh command forces an immediate display update. It may also be used to reflect changes made through one editing screen on the other ones,
Close closes the edit form; all unsaved changes are lost.
For the measurements and results the data file names are displayed. If the given file cannot be found in the specified location its name is displayed in red and, additionally, the Not found! mark is displayed on the right. If the file is present, its name is displayed in black.
Below are given detailed descriptions of each of the forms.
In the Select frame there is only one combo box; it contains all available material identifiers. Selecting one causes the current record to change details of the selected one are displayed in labelled text boxes.
In the Select frame there are two combo boxes. The upper one allows the material to be selected. When the selection is done the data filtering action is performed and, as a result, only samples being made of the selected material are displayed. Pressing the [all] button restores full data set. The lower combo box contains identifiers of samples available for the display (this depends on filtering condition). Selecting one of them causes current record to change details of the selected one are displayed in labelled text boxes. Box labelled Material has grey background, i.e. it cannot be edited.
In the Select frame there are three combo boxes. The upper one allows a sample to be selected (it is displayed together with material identifier). When the selection is done the data filtering action is performed and only the measurements being made for the selected material-sample combination chosen are displayed. Pressing the [all] button restores full data set view.
The middle one allows for selecting the measurement type. It is also used for the data filtering.
The lowest combo box contains identifiers of the measurements available for display (this depends on the filtering condition). Selecting one causes the current record to change details of the selected one are displayed.
Data file path, displayed in frame labelled Data file can be edited: one can choose path from the list. If required path is not available in the list it is possible to add it into it using Paths dialog, invoked through Paths... button. In order to facilitate looking for missing files it is possible to invoke standard Windows Open file dialog using Find it button.
Sample assignment cannot be changed directly, but it may be changed using appropriate dialog invoked through ⊗ button. Changes made in the base can be accompanied with changes in corresponding files.
The main part of measurement data is displayed in form of list. Parameter order is the same as in measurement type definition (and can be changed through the Measurement Definition dialog form). Parameters with names preceded by an asterisk may be edited; double-click the item to invoke appropriate dialog window.
Import of the new measurement data file is invoked with the Import button. If Relative p. checkbox is set, the data file path will be stored in the base as relative to the database folder or as fully qualified absolute path otherwise. If a reference to the file selected for input is already stored in the base, the import is aborted unless the Reload checkbox is set, in which case data from the file replace corresponding data already stored in the base.
Export button invokes routine used to write current measurement data as a text file in CSV format, stripped of all additional information.
In the Select frame there are four combo boxes. The upper one allows a measurement to be selected (it is displayed together with material identifier). When selected it causes data filtering: only results derrived from the selected measurement data are displayed. Pressing [all] button restores full data view.
The second one allows a measurement file to be selected instead of the measurement description. It performs the same role as previous, topmost combo.
The third one allows a computing method applied to measurement data to be selected. It is also used for data filtering.
The lowest combo box contains identifiers of results (result file names) available for display (this depends on filtering condition.
Selecting one causes the current record to change details of the selected one are displayed.
Data file path, displayed in frame labelled Data file can be edited: one can choose path from the list. If required path is not available in the list it is possible to add one into it using Paths dialog, invoked through the Paths... button. In order to facilitate looking for missing files it is possible to invoke standard Windows Open file dialog using Find it button.
Import of the new result data file is invoked with the Import button. If Relative p. checkbox is set, the data file path will be stored in the base as relative to the database folder or as fully qualified absolute path otherwise. If a reference to the file selected for input already exists in the base, the import is aborted.
Export button invokes routine used to write current result data as a text file in CSV format, stripped of all additional information.